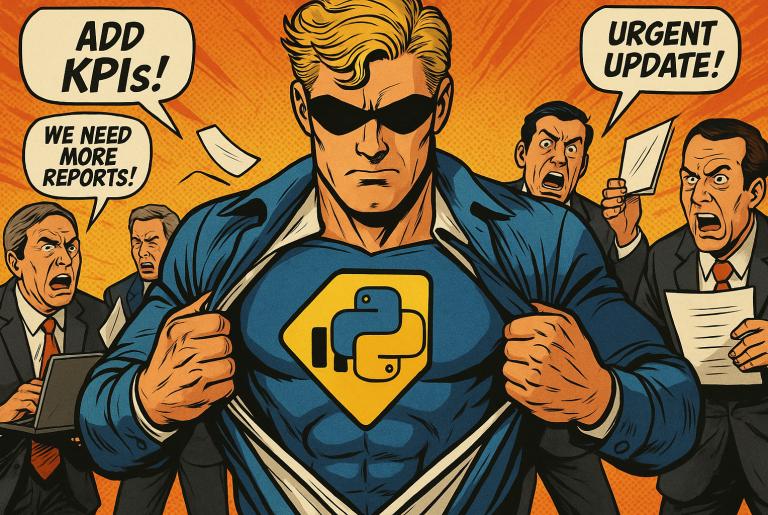
Enhance your business analysis with custom Power BI reports


For more than a decade, I have been supporting decision-makers by delivering tailored, data-driven reports.
These insights are produced using Microsoft Excel or Power BI Desktop—one of the most powerful business intelligence tools available.
As part of the Microsoft ecosystem, Power BI stands out for its seamless integration and interoperability, making it an invaluable asset for executives and business leaders.
May 30th, 2025
Building a Mobile App with AI: From Excel to iPhone
Between two job applications, I challenged myself to build a mobile app -directly on my iPhone 11. A few tutorials and a strong dose of motivation later, Xcode was up and running on my Mac (yes, I’m multi-OS: Mac by passion, PC by necessity).
The concept was simple: turn my Excel-based freelance tax calculator into an iOS app. Designed for freelancers in Malta but open to the world, the app calculates net income after taxes by factoring in gross daily rates (EUR/USD/GBP/CHF/AED), annual expenses, and current exchange rates via a free online API.
Beyond the fun of the calculations, I wanted to understand how to build a mobile app with AI. It quickly became clear: AI is powerful, but only when guided precisely. Clear prompts, realistic goals, and a well-defined structure are key. AI won’t challenge your logic—you must do that yourself.
Most coding errors weren’t “AI mistakes” but flaws in how I framed the request. The lesson? AI is a partner, not a magician. Define your vision before hitting "generate."
Tech stack:
- Xcode (Swift) & VS Code on Mac
- Excel on PC
- Free currency API
- iPhone 11 for testing
- AI used: GPT-4o (85%), Claude 3.5 (10%), GPT-4.1 (5%)—though GPT-4o alone could’ve handled it all
This hands-on experiment boosted both my coding and product thinking skills. It’s one thing to analyse data—it’s another to turn insights into tools.
May 22nd, 2025
AI is not replacing me - It's empowering me

In my job search as a Data Analyst, I’ve made one thing clear: AI is not a threat. It’s a career accelerator.
A year ago, I couldn’t do half of what I can today. Thanks to AI tools, my technical capabilities and business insights have grown exponentially. GitHub Copilot, for instance, helps developers code 55% faster. Google’s own research shows a 21% time-reduction on complex tasks with AI assistance. And in DevOps teams, 60% have reported higher efficiency in testing, coding, and even security thanks to AI.
This is not theory. I’ve lived it.
In just one year, I’ve grown my knowledge and productivity a thousandfold. From Power BI and SQL to Python, API integrations, and ETL automation - AI has enabled me to deliver advanced reporting systems, faster and smarter.
But AI alone is not the answer. The real value comes from curiosity, persistence, and the will to learn every day. I see AI as a powerful ally - a digital co-pilot, not a replacement.
It’s like the car in the industrial age or nuclear power in the 20th century: a revolutionary boost in productivity for those who know how to harness it.
Companies that adopt AI and invest in people who know how to use it will see faster delivery, smarter insights, and greater ROI.
So yes, I’m actively looking for my next challenge. And no, I’m not doing it alone - AI is part of the journey.
Let’s talk about what we can build together - human creativity, amplified by artificial intelligence.
May 20th, 2025
From Application to Action: Building a Real-Time Web Analytics Dashboard

During my job search, I applied for a role as a Data Analyst. One key requirement: mastering web traffic tracking using Google Analytics and Google Tag Manager (GTM). I was already familiar with GA — I’d previously built Power BI dashboards across four websites — but GTM was new territory.
Instead of just reading documentation, I got hands-on. I used my own website, www.durandeau.io, as a testing ground.
I configured GTM to manage GA4 tags and variables, and connected Power BI directly to the dataset. I then designed a fully interactive dashboard, integrating Deneb custom visuals built with JSON and Vega-Lite — a powerful, open-source charting library (vega.github.io/vega-lite).
The result? A clean, real-time web performance report showing bounce rate patterns, traffic by country/device/browser, and user engagement over time. The Deneb visuals brought clarity and flexibility far beyond standard charts.
This project turned a job spec into a learning opportunity — and a portfolio piece that proves initiative, adaptability, and end-to-end BI capability.
May 7nd, 2025
Pushing Power BI Limits:
My Spotify Data Challenge
As a Data Analyst & BI Developer, I often bridge the gap between data and design—without being a full-time coder. My latest project: a Spotify insights report where I blended multiple coding languages to enhance interactivity and design.
- ETL with Python (VS Code): Automated retrieval of album cover URLs using the Spotify API.
- DAX + HTML: Embedded an HTML script inside a DAX measure to dynamically render album art in Power BI.
- Deneb (JSON): Developed two custom visuals—a Gauge and a Heatmap—pushing Power BI’s native capabilities further.
The live report is available here: Spotify Report
Big thanks to @Park for his insightful YouTube tutorial
As I’ve shared before: I’m not a developer, but I code when the solution demands it. This approach keeps me flexible and sharp in a fast-changing BI landscape.
What’s your take? How do you integrate coding into your analytics workflow without becoming a full-time developer?

May 2nd, 2025
“Python in Power BI:
Not a Developer, Still a Data Scientist”
As a Data Analyst, I don’t consider myself a Python developer.
But I’ve learned to make Python work for me — especially when I need deeper, smarter, sharper insights in Power BI.
Recently, I explored how to use Python inside Power BI to go beyond standard visuals:
- Violin plots, KDE, residual analysis
- Correlation heatmaps, outlier detection
- Forecasting models with Prophet and ARIMA
BUT here’s the real-world reality:
Power BI’s Python visuals can’t be published to the web, and not all packages are supported in the Power BI Service.
For a data analyst, that’s a big limitation — because our job is to build reports that are eventually shared with teams, managers, and decision-makers.
So while Python unlocks powerful analysis, I still rely on Power BI’s native visuals for smooth, interactive, and shareable dashboards.
I’m not a Python coder.
I’m a problem-solver — and Python is one of the tools I use to solve better (when it makes sense).
Thanks to the training and deep dive I completed, I built something I’m proud to share — stay tuned for more.

April 23rd, 2025
Power BI Brilliance:
Inside the Work of a Modern Data Analyst
From raw numbers to business insight — that's the daily craft of a Data Analyst, especially one mastering Power BI. A recent sales report on IT products showcases the creative and strategic power behind the tool. Beyond classic dashboards, this report introduces interactive visuals and an innovative forecast feature powered by Power BI’s What-if function.
Users can simulate future scenarios by adjusting prices, quantities sold, and discount rates, instantly seeing projected revenue, profit, and sales volume for the coming year.
A special thanks goes to Bas, a standout in the Power BI community, whose YouTube tutorials inspired much of the visual design.
You can explore the report at www.durandeau.io
As businesses rely more on data storytelling, one question remains:
How far can data-driven simulations take your decision-making?

April 18th, 2025
From Dashboards to Data Models:
A Data Analyst’s Journey Beyond Power BI
As a Data Analyst specialized in Power BI, I’ve long focused on interactive dashboards and real-time visual insights. But recently, I stepped into another side of the data world — the core components of the Microsoft SQL Server suite: SSMS, SSIS, SSDT, SSRS… and SSAS.
When I was asked to migrate SSRS reports from a cube-based system to a more conventional model, I had to dig deeper than just the reports. I started exploring the underlying multidimensional cubes in SSAS, learning how they’re structured through fact and dimension tables, KPI logic, and MDX-based calculations. I even went on to build a cube from scratch using SSDT, connecting it to Power BI and understanding how performance and governance differ from the usual in-memory dataset approach.
This journey reshaped how I see data reporting:
- SSRS showed me the value of structured, pixel-perfect reports still critical for operations and compliance
- SSAS gave me a new appreciation for semantic modelling, performance optimization, and OLAP analysis
- SSDT helped me bridge everything with a developer’s mindset: versioning, deployment, automation
Power BI is powerful, but it’s not replacing SSRS or SSAS — it's complementing them. Businesses don’t just need insights — they need trust, structure, and continuity. Migrating from cubes to DAX-based models is about more than rebuilding — it's about understanding the legacy and translating it into something sustainable.
👉 What legacy tools have you rediscovered in your modern data journey?

Nous avons besoin de votre consentement pour charger les traductions
Nous utilisons un service tiers pour traduire le contenu du site web qui peut collecter des données sur votre activité. Veuillez consulter les détails dans la politique de confidentialité et accepter le service pour voir les traductions.
